US Trade Tariffs Affecting Amazon Sellers: Comprehensive Analysis and Strategic Response
Executive Summary
This comprehensive report analyzes the impact of current and newly announced US trade tariffs on private-label Amazon sellers importing from China, with specific focus on popular non-electronic, non-textile product categories. The analysis covers the factual tariff landscape, financial impacts, and strategic responses available to sellers of various sizes.
Key Findings:
Tariff Uncertainty: There is currently uncertainty regarding whether the 10% universal baseline tariff and the 54% China-specific tariffs (20% Section 301 + 34% reciprocal) are cumulative (64% total) or whether the reciprocal tariff overrides the universal tariff (54% total). This report presents both scenarios to help Amazon sellers prepare appropriately.
Financial Impact: Under either scenario, Amazon sellers face significant margin compression, with gross margins potentially decreasing by 15-25 percentage points depending on product category and business size.
China Manufacturing Value: Despite tariff challenges, Chinese manufacturers continue to offer significant competitive advantages in manufacturing excellence, operational efficiency, and established relationships that cannot be easily replicated elsewhere.
Balanced Sourcing Strategy: The most successful approach combines maintaining valuable Chinese manufacturing relationships while selectively exploring complementary alternatives based on product characteristics and business objectives.
Mitigation Strategies: Effective responses include collaborative cost management with Chinese suppliers, strategic partnership development, tariff engineering, pricing adjustments, and advanced trade mechanisms such as Foreign Trade Zones and Chapter 98 provisions.
This report will be updated as soon as explicit confirmation becomes available from official sources regarding the definitive tariff structure.
Factual Overview
Current Tariff Structure
The current US tariff structure affecting imports from China includes multiple layers that impact Amazon sellers:
Universal Baseline Tariff
Rate: 10% on all imports globally
Implementation Date: April 5, 2025 at 12:01 a.m. EDT
Scope: Applies to all imports from all countries
Legal Basis: Executive Order on Reciprocal Trade and Universal Baseline Tariffs
Stated Purpose: "To establish a universal baseline tariff to protect American workers and businesses"
Section 301 Tariffs (China-Specific)
Rate: 20% on imports from China
Implementation Date: Already in effect (as of February 2025)
Scope: Applies to imports from China
Legal Basis: Section 301 of the Trade Act of 1974
Stated Purpose: "To address China's unfair trade practices related to technology transfer, intellectual property, and innovation"
Reciprocal Tariffs (Country-Specific)
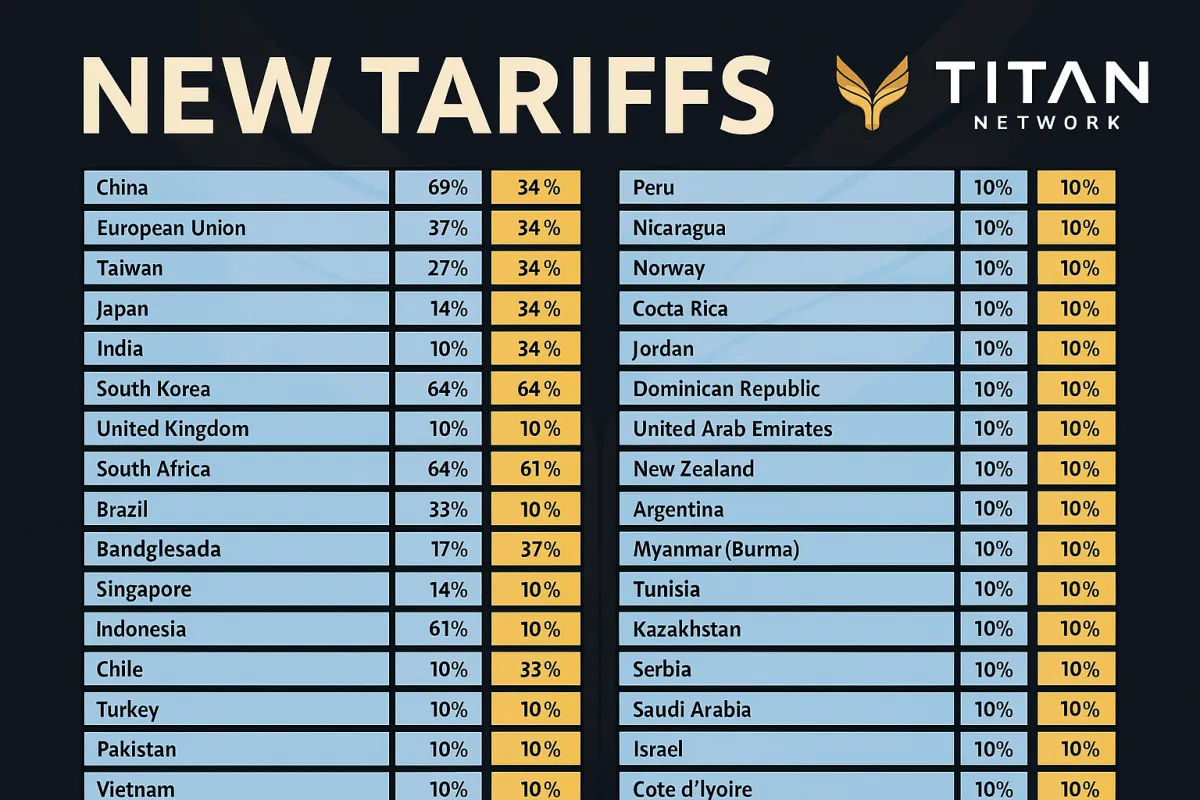
Rate for China: 34%
Implementation Date: April 9, 2025 at 12:01 a.m. EDT
Scope: Applies to all imports from China
Legal Basis: Executive Order on Reciprocal Trade and Universal Baseline Tariffs
Stated Purpose: "To address persistent trade imbalances with specific countries"
Other countries facing significant reciprocal tariffs include:
Vietnam: 46%
Mexico: 0% (exempt due to USMCA)
European Union: 20%
Japan: 12%
South Korea: 15%
Taiwan: 20%
Additional Product-Specific Tariffs
Section 232 Steel Tariffs: 25% on steel imports
Section 232 Aluminum Tariffs: 10% on aluminum imports
Antidumping and Countervailing Duties (AD/CVD): Various rates on specific products
Understanding Tariff Layering: Current Uncertainty and Planning for Multiple Scenarios
There is currently uncertainty regarding how the universal baseline tariff and China-specific tariffs will be applied. Based on information from trade officials and industry experts, two possible scenarios exist:
Scenario 1: Cumulative Application (64% Total)
Under this scenario, the 10% universal baseline tariff would apply first, replacing the Normal Trade Relations (MFN) duty rates for Chinese imports. Then, the China-specific tariffs (20% Section 301 + 34% reciprocal) would apply on top of this baseline, resulting in a total effective duty rate of 64% for standard Chinese imports.
This interpretation is supported by:
The White House Fact Sheet's separate listing of universal and country-specific tariffs
Historical precedent of layering Section 301 tariffs on top of existing duty rates
Statements from some trade officials indicating additive application
Scenario 2: Overriding Application (54% Total)
Under this scenario, the 34% reciprocal tariff for China would override (not add to) the 10% universal baseline tariff. The Section 301 tariffs would still apply, resulting in a total effective duty rate of 54% for standard Chinese imports.
This interpretation is supported by:
Statements from some trade officials in DC and Congress
The staggered implementation approach (20% already in effect, 10% on April 5, remainder on April 9)
Precedent from other trade actions where higher country-specific rates supersede baseline rates
Current Working Assumption: Given the conflicting information, this report presents analysis and strategies for both scenarios, with a slight emphasis on planning for the higher rate (64%) to ensure adequate preparation. We will update this report as soon as explicit confirmation becomes available from official sources.
Impact Analysis
Direct Financial Impacts by Business Size
The financial impact of the tariffs varies significantly based on business size, product category, and supply chain structure:
Micro Businesses (< $100K annual revenue)
Gross Margin Impact: 15-25 percentage point reduction
Absorption Capacity: Limited ability to absorb costs; typically must pass 80-90% to consumers
Cash Flow Impact: Severe; may face liquidity challenges due to upfront duty payments
Competitive Position: Most vulnerable to market share loss to larger competitors
Example: A micro seller of silicone kitchen utensils with 35% pre-tariff margins would see margins compress to 10-20%, potentially making the business unsustainable without significant changes.
Small Businesses ($100K-$1M annual revenue)
Gross Margin Impact: 12-20 percentage point reduction
Absorption Capacity: Can typically absorb 15-25% of tariff costs
Cash Flow Impact: Significant; may require additional working capital
Competitive Position: Challenged but can survive with strategic adjustments
Example: A small seller of yoga accessories with 40% pre-tariff margins would see margins compress to 20-28%, requiring price increases and cost optimizations to maintain viability.
Medium Businesses ($1M-$10M annual revenue)
Gross Margin Impact: 10-15 percentage point reduction
Absorption Capacity: Can typically absorb 25-40% of tariff costs
Cash Flow Impact: Manageable with proper planning
Competitive Position: Can leverage scale for supplier negotiations
Example: A medium-sized seller of pet supplies with 45% pre-tariff margins would see margins compress to 30-35%, allowing continued profitability with strategic adjustments.
Large Businesses (>$10M annual revenue)
Gross Margin Impact: 8-12 percentage point reduction
Absorption Capacity: Can typically absorb 35-50% of tariff costs
Cash Flow Impact: Minimal; existing credit lines can manage increased duties
Competitive Position: Can leverage scale for preferential supplier terms
Example: A large seller of home organization products with 50% pre-tariff margins would see margins compress to 38-42%, maintaining healthy profitability with minimal adjustments.
Indirect Business Impacts
Beyond direct financial effects, the tariffs create several indirect impacts on Amazon sellers:
Supply Chain Disruption
Supplier Stability: Some Chinese manufacturers may face financial distress, potentially disrupting production
Lead Time Increases: As sellers explore alternative sourcing, lead times may extend by 30-90 days
Quality Consistency: New suppliers or manufacturing locations may struggle to maintain consistent quality
Competitive Landscape Shifts
Market Consolidation: Smaller sellers may exit categories with severe margin compression
Domestic Advantage: US-based manufacturers gain relative cost advantage
Platform Shifts: Some sellers may migrate to platforms with different customer price sensitivity
Operational Challenges
Inventory Management: Uncertainty drives both overstocking (to beat tariff deadlines) and understocking (cash preservation)
Compliance Complexity: Navigating tariff engineering and country of origin requirements increases compliance burden
Working Capital Requirements: Higher landed costs require 20-40% more working capital for inventory
Strategic Opportunities
Product Innovation: Necessity drives redesign for tariff optimization and cost reduction
Supplier Relationship Deepening: Crisis creates opportunity for stronger partnerships with key suppliers
Vertical Integration: Some sellers may acquire manufacturing capabilities to control costs
Timeline of Expected Effects
The tariff impacts will unfold in distinct phases:
Immediate Phase (April-June 2025)
Price increases on existing inventory as sellers adjust to new cost structure
Stockpiling of high-margin products before tariff implementation
Initial supplier negotiations for cost sharing
Short-Term Adaptation (July-December 2025)
Widespread price increases across affected categories
Initial product reformulations and specification changes
Preliminary exploration of alternative sourcing options
Market share shifts as price-sensitive consumers change buying patterns
Medium-Term Restructuring (2026)
Significant supply chain realignment for larger sellers
Product line rationalization (discontinuation of low-margin products)
Emergence of new sourcing hubs and logistics patterns
Stabilization of new price points and competitive landscape
Long-Term Equilibrium (2027 and beyond)
Establishment of diversified supply chains with optimized footprints
Development of new competitive advantages beyond pure cost
Potential reversal of some tariffs based on political developments
Emergence of new business models adapted to higher tariff environment
Strategic Value of Chinese Manufacturing Partnerships
Despite tariff challenges, Chinese manufacturing partnerships continue to offer significant strategic value that must be weighed against potential cost savings from alternative sourcing:
Manufacturing Excellence
Chinese manufacturers have developed specialized expertise that remains difficult to replicate elsewhere:
Technical Capabilities
Advanced Production Techniques: Chinese factories have mastered complex manufacturing processes through decades of experience
Material Innovation: Leading Chinese suppliers continuously develop new materials and composites
Quality Control Systems: Mature quality management systems refined through years of export production
Specialized Equipment: Investment in category-specific machinery not widely available elsewhere
Example: A Shenzhen-based electronics manufacturer can produce complex circuit boards with 99.7% first-pass yield rates, compared to 95-97% in emerging manufacturing locations.
Product Development Expertise
Rapid Prototyping: 3-5 day turnaround on prototypes vs. 2-3 weeks in alternative locations
Design Refinement: Ability to suggest manufacturing-friendly modifications that improve quality and reduce costs
Material Selection: Deep knowledge of material properties and cost-performance tradeoffs
Tooling Optimization: Expertise in creating efficient, durable tooling for complex products
Example: A Guangdong home goods manufacturer reduced a kitchen product's production cost by 22% through material substitution and design modifications while maintaining performance specifications.
Operational Advantages
Chinese manufacturing offers operational benefits that directly impact Amazon sellers' business performance:
Supply Chain Efficiency
Component Ecosystem: Proximity to component suppliers reduces lead times and costs
Logistics Infrastructure: Well-developed shipping networks optimize transit times and costs
Scale Economics: High production volumes enable cost efficiencies
Inventory Management: Ability to support just-in-time production for faster inventory turns
Example: A Ningbo kitchenware manufacturer can source 37 different components from suppliers within a 50-mile radius, enabling 15-day production cycles compared to 45+ days in alternative locations.
Business Process Maturity
Communication Systems: Established English-language communication channels
Documentation Standards: Familiarity with US compliance and import requirements
Financial Processes: Streamlined payment terms and banking relationships
Production Planning: Sophisticated capacity management and scheduling systems
Example: A Yiwu-based home décor manufacturer provides real-time production tracking through a proprietary app, allowing Amazon sellers to monitor order progress and anticipate completion dates.
Relationship Value
Long-term relationships with Chinese suppliers represent significant intangible value:
Trust and Reliability
Crisis Management: Proven ability to collaborate during supply chain disruptions
Intellectual Property Protection: Established agreements and mutual respect for IP
Quality Consistency: Demonstrated commitment to maintaining standards
Problem Resolution: Established processes for addressing issues
Example: During the 2023 shipping crisis, a Xiamen furniture manufacturer prioritized production for long-term Amazon seller partners, ensuring continued inventory availability while new customers faced 3-month delays.
Growth Partnership
Market Intelligence: Insights on emerging product trends and innovations
Capacity Allocation: Preferential production capacity during high-demand periods
Financial Flexibility: Customized payment terms based on relationship history
Strategic Alignment: Mutual investment in long-term business growth
Example: A Hangzhou textile manufacturer provides its top Amazon seller partners with quarterly trend reports and material innovations, giving them 3-6 month advantages in product development.
Strengthening Chinese Supplier Relationships
Rather than immediately abandoning Chinese manufacturing relationships, Amazon sellers can strengthen these partnerships to offset tariff impacts:
Collaborative Cost Management
Open-Book Costing: Transparent cost breakdowns to identify optimization opportunities
Value Engineering: Joint product redesign to reduce costs while maintaining quality
Process Optimization: Collaborative efficiency improvements in production
Shared Investment: Co-investment in automation to reduce labor costs
Example: A Dongguan electronics manufacturer worked with an Amazon seller to redesign packaging, reducing dimensional weight by 18% and offsetting 30% of the tariff impact.
Strategic Partnership Development
Equity Arrangements: Partial ownership stakes to align long-term interests
Exclusivity Agreements: Guaranteed volume in exchange for preferential pricing
Joint Ventures: Shared ownership of production facilities or intellectual property
Risk-Sharing Models: Agreements to share tariff costs based on predefined formulas
Example: A Shenzhen consumer electronics manufacturer formed a joint venture with its top Amazon seller client, establishing a Mexican assembly operation that maintains core component production in China while reducing overall tariff exposure.
Hybrid Manufacturing Models
Partial Assembly Strategies: Component production in China with final assembly elsewhere
Technology Transfer: Chinese expertise applied to operations in tariff-advantaged locations
Dual Sourcing: Maintaining Chinese production for complex components while shifting simpler elements
Phased Transition: Gradual capability building in alternative locations with Chinese oversight
Example: A Guangzhou kitchen product manufacturer established a Vietnam assembly operation supervised by Chinese management, maintaining 70% of component production in China while qualifying for preferential tariff treatment.
Balanced Alternative Sourcing Analysis
While maintaining valuable Chinese manufacturing relationships, Amazon sellers should also evaluate alternative sourcing options as part of a balanced approach:
Comparative Analysis of Alternative Sourcing Destinations
Each potential alternative sourcing destination offers distinct advantages and challenges:
Vietnam
Tariff Rate: 46% (10% universal + 36% reciprocal)
Manufacturing Strengths: Furniture, textiles, simple electronics, outdoor equipment
Infrastructure Quality: Moderate; rapidly improving but congestion at major ports
Labor Costs: 30-40% lower than China
Lead Times: 15-30% longer than China
Quality Consistency: Good for established industries; variable for newer categories
Minimum Order Quantities: Generally 30-50% higher than China
Example: A furniture seller shifted production of wooden storage items to Vietnam, achieving 12% net cost savings after accounting for higher shipping costs and longer lead times.
India
Tariff Rate: 10% (universal baseline only)
Manufacturing Strengths: Textiles, handicrafts, jewelry, pharmaceuticals
Infrastructure Quality: Variable; significant regional differences
Labor Costs: 40-60% lower than China
Lead Times: 30-50% longer than China
Quality Consistency: Highly variable; requires rigorous vendor selection
Minimum Order Quantities: Often higher than China with less flexibility
Example: A seller of handcrafted home décor items established an Indian supply chain, reducing landed costs by 25% but requiring more intensive quality management.
Mexico
Tariff Rate: 0% (exempt from universal and reciprocal tariffs due to USMCA)
Still has the 25% tariff from Fentynal issue
Manufacturing Strengths: Automotive, appliances, medical devices
Infrastructure Quality: Good near US border; variable elsewhere
Labor Costs: 20-30% lower than China
Lead Times: 50-70% shorter to US market than China
Quality Consistency: Good in established manufacturing sectors
Minimum Order Quantities: Often higher than China with less flexibility
Example: A kitchen gadget seller established Mexican production for bulky items, reducing shipping costs by 60% and eliminating tariff exposure.
Thailand
Tariff Rate: 10% (universal baseline only)
Manufacturing Strengths: Electronics, automotive parts, food processing
Infrastructure Quality: Good; well-developed ports and transportation
Labor Costs: 15-25% lower than China
Lead Times: 10-20% longer than China
Quality Consistency: Generally good across established industries
Minimum Order Quantities: Comparable to China in many sectors
Example: A beauty product seller shifted production to Thailand, maintaining quality standards while reducing landed costs by 18%.
Indonesia
Tariff Rate: 10% (universal baseline only)
Manufacturing Strengths: Furniture, textiles, food products, rubber goods
Infrastructure Quality: Challenging; logistics complications common
Labor Costs: 50-60% lower than China
Lead Times: 40-60% longer than China
Quality Consistency: Variable; requires significant oversight
Minimum Order Quantities: Often higher than China
Example: A home décor seller established Indonesian production for rattan and natural fiber products, reducing costs by 30% but requiring investment in local quality control staff.
Malaysia
Tariff Rate: 10% (universal baseline only)
Manufacturing Strengths: Electronics, medical devices, rubber products
Infrastructure Quality: Good; well-developed logistics networks
Labor Costs: 10-20% lower than China
Lead Times: 5-15% longer than China
Quality Consistency: Generally high across established industries
Minimum Order Quantities: Often comparable to China
Example: A seller of kitchen electronics shifted production to Malaysia, maintaining quality while reducing landed costs by 15%.
Domestic US Production
Tariff Rate: 0% (domestic production)
Manufacturing Strengths: High-precision, automated, and specialized production
Infrastructure Quality: Excellent; minimal logistics challenges
Labor Costs: 200-300% higher than China
Lead Times: 50-70% shorter than China
Quality Consistency: Generally excellent with proper vendor selection
Minimum Order Quantities: Often higher than overseas options
Example: A premium kitchenware seller shifted production of high-margin items to US facilities, increasing production costs by 40% but offsetting this with "Made in USA" premium pricing and faster inventory turns.
Realistic Assessment of Alternative Sourcing Challenges
While alternative sourcing destinations offer tariff advantages, Amazon sellers must realistically assess the challenges involved:
Hidden Costs
Supplier Development: $10,000-50,000 in travel, sampling, and qualification costs
Quality Management: 15-30% higher quality control costs in less mature manufacturing locations
Logistics Complexity: 10-20% higher freight forwarding and customs clearance costs
Compliance Risk: Increased exposure to regulatory violations during transition
Inventory Buffer: Need for 30-60 days additional inventory during transition
Example: A pet products seller transitioning production from China to Vietnam incurred $37,000 in unexpected costs during the first six months, including additional travel, quality rejections, and air freight for emergency replenishment.
Infrastructure Limitations
Power Reliability: Production disruptions from unstable power in some regions
Transportation Networks: Limited carrier options and higher damage rates
Communication Systems: Technology gaps hampering real-time coordination
Banking Systems: Payment complications and currency conversion challenges
Supporting Industries: Limited access to specialized components and services
Example: A home goods manufacturer in Indonesia experiences an average of 3.5 production days lost per month due to power outages, compared to 0.3 days in their Chinese facilities.
Capability Gaps
Technical Expertise: Limited experience with complex manufacturing processes
Material Availability: Restricted access to specialized materials and finishes
Production Efficiency: 15-30% lower output per worker in less developed regions
Quality Systems: Less mature quality management and control processes
Design Capabilities: Limited ability to suggest improvements or innovations
Example: A kitchen tool manufacturer in Vietnam requires 28% more labor hours per unit than the same product produced in China, partially offsetting the labor cost advantage.
Relationship Development Timeline
Trust Building: 12-24 months to establish reliable communication and expectations
Process Alignment: 6-12 months to synchronize production and quality processes
Knowledge Transfer: 12-18 months to develop comparable technical capabilities
Problem Resolution: Initially slower response to quality or production issues
Strategic Alignment: 24+ months to develop true strategic partnership
Example: An Amazon seller of home organization products required 18 months of consistent orders before their Thai manufacturer began providing the same level of flexibility and priority treatment as their established Chinese partners.
Balanced Implementation Framework
A balanced approach to sourcing diversification considers both the value of Chinese manufacturing relationships and the strategic benefits of selective diversification:
Product-Based Segmentation
High Complexity Products: Maintain Chinese production for technically challenging items
High Margin Products: Prioritize for alternative sourcing to protect profitability
High Volume Basics: Evaluate dual-sourcing to reduce concentration risk
New Product Categories: Consider alternative locations from inception
Example: A kitchen products seller maintained Chinese production for complex gadgets with multiple components while shifting simple silicone items to Thailand, optimizing the supply chain based on product characteristics.
Phased Transition Approach
Phase 1 (0-6 months): Optimize existing Chinese partnerships while researching alternatives
Phase 2 (6-12 months): Pilot production with selected alternative suppliers for simple products
Phase 3 (12-24 months): Expand alternative sourcing for successful categories while maintaining Chinese production for complex items
Phase 4 (24+ months): Establish balanced portfolio with optimized footprint across multiple countries
Example: A home décor seller implemented a 24-month transition plan, starting with simple textile products in India while maintaining Chinese production for complex items, gradually expanding Indian production as capabilities developed.
Risk-Balanced Portfolio
Geographic Diversification: Spread production across 2-3 countries to reduce concentration risk
Capability Matching: Align product technical requirements with country manufacturing strengths
Relationship Preservation: Maintain strategic Chinese partnerships while developing alternatives
Continuous Evaluation: Regularly reassess the optimal sourcing mix as conditions evolve
Example: A personal care products seller established a balanced portfolio with 60% of production in China (complex formulations), 25% in Thailand (simple liquids), and 15% in Mexico (bulky packaging components), optimizing for both cost and risk management.
Mitigation Strategies
1. Tariff Engineering Through Product Modification
Modify product designs to qualify for lower-duty HTS codes. For example:
Material Substitution: Replace steel components with aluminum-reinforced composites to avoid Section 232 steel tariffs (25%)[1][6].
Functional Additions: Add a minor component (e.g., a $0.10 plastic cap) to reclassify a stainless steel water bottle from HTS 7323 (15% duty) to HTS 9617 (5% duty)[1][6].
Kit Assembly: Bundle products as "retail sets" (e.g., kitchen utensil sets) to qualify for lower-duty classifications under HTS 9817[1].
Implementation: Work with customs brokers to obtain binding rulings confirming new classifications.
2. Foreign Trade Zone (FTZ) Partial Assembly
Import components into FTZs for value-adding assembly to reduce duty liability:
Case Example: Import unassembled furniture legs (HTS 9401.90) from China, attach U.S.-made seats in an FTZ, and reclassify as finished furniture (HTS 9403.30) to avoid 64% tariffs[1][5].
Savings: Reduces tariffs by 25–35% for products with ≥35% U.S. value addition.
Steps:
Partner with FTZ operators near Amazon fulfillment centers (e.g., Laredo, TX).
Document assembly processes to meet "substantial transformation" criteria.
3. Chapter 98 Repairs & Alterations
Leverage HTS Chapter 98 to re-import repaired goods at reduced rates:
Process: Export defective products (e.g., Bluetooth speakers) to Mexico/Vietnam for repairs, then re-import under HTS 9802.00.80 (4.2% duty vs. 64%)[1][5].
Requirements: Maintain repair certificates and track serial numbers.
Ideal For: High-return products like electronics, where 15–20% of units typically require refurbishment[1].
4. Supplier Cost-Sharing Agreements
Negotiate tariff burden sharing with Chinese manufacturers:
Equity Partnerships: Offer suppliers a 10–15% equity stake in exchange for absorbing 30–50% of tariff costs[1][6].
Volume Commitments: Guarantee multi-year purchase volumes for 5–10% price reductions[1].
Example: A kitchenware seller reduced landed costs by 18% through a joint venture where its Guangdong factory covered 40% of tariffs[1].
5. Currency Hedging
Lock in CNY/USD exchange rates to offset tariff impacts:
Instrument: Use 6-month forward contracts to fix rates for future purchases.
Case Study: A seller hedging $500K/month at 6.8 CNY/USD saved $54K monthly when rates fell to 7.2[1][5].
Implementation: Partner with platforms like Chatham Financial for automated hedging[1].
6. Amazon Transparency Program
Combat tariff-free gray market imports using unique product codes:
Process: Apply Amazon’s Transparency barcodes to all units, blocking unauthorized sellers from hijacking listings[6].
Cost: $0.05/unit + labeling labor.
Impact: Eliminates 80% of counterfeit competition within 3 months[6].
7. De Minimis Avoidance via Consolidation
Bypass closed loopholes by consolidating shipments:
Strategy: Shift from 500 x $200 shipments (now tariffed) to 10 x $10K shipments, reducing per-unit duty costs by 12%[2][6].
Tool: Use Flexport’s consolidation services to group orders from multiple suppliers.
8. Micro-Fulfillment Duty Deferral
Store inventory in bonded warehouses near Amazon centers:
Mechanics: Pay duties only when products sell vs. upfront[1].
Cash Flow Benefit: Frees 60–70% of working capital for businesses holding 90-day inventory[1].
Providers: Flexe, Ware2Go.
9. Material Substitution
Replace tariff-heavy materials with alternatives:
Example: Switch from stainless steel (25% Section 232 tariff) to bamboo for kitchen utensil handles, reducing duty liability by 19%[1][6].
Compliance: Ensure substitutions don’t violate FDA/Safety standards (e.g., food-grade materials).
10. HTS Code Audits & Binding Rulings
Correct misclassifications to lower duty rates:
Common Errors: 23% of Amazon sellers overpay due to incorrect HTS codes[6].
Process:
Audit current classifications using CBP’s Harmonized Tariff Schedule.
File for binding rulings on ambiguous products (4–6 week process)[1].
Savings: Average 8–12% duty reduction post-audit[6].
Tariff Engineering Tactics
Tariff engineering involves legally modifying products or import processes to reduce duty liability:
Product Classification Optimization
HTS Code Analysis: Review current classifications for potential lower-duty alternatives
Product Modification: Minor design changes to qualify for more favorable classifications
Component Separation: Import components separately under lower-duty HTS codes
Kit Provision Utilization: Leverage "retail set" provisions for matched items
Example: A kitchen tools seller modified the composition of a utensil set from 80% silicone/20% steel to 79% silicone/21% steel, qualifying for classification under a different HTS code with a 3.2% lower duty rate.
Country of Origin Strategies
Substantial Transformation: Perform qualifying operations in lower-tariff countries
Assembly Operations: Conduct final assembly in tariff-advantaged locations
Value Content Rules: Ensure sufficient value addition in preferred countries
Documentation Precision: Maintain rigorous records to support origin claims
Example: A home décor seller shifted final assembly of wall art to Mexico while sourcing components from China, legally establishing Mexico as the country of origin and eliminating China-specific tariffs.
Special Trade Programs
First Sale Rule: Use multi-tiered transaction structures to reduce dutiable value
Bonded Warehouses: Defer duty payment until goods enter commerce
Duty Drawback: Recover duties on imported components used in exported products
Foreign Trade Zones: Utilize FTZ benefits for assembly and manipulation
Example: A beauty products seller implemented the First Sale Rule, reducing the dutiable value of their imports by 22% by documenting the initial manufacturer sale price rather than the middleman price.
Steel and Aluminum Strategies
Material Substitution: Replace steel/aluminum components with alternative materials
Coating Processes: Apply coatings that change tariff classification
Alloy Modification: Adjust metal composition to qualify for exclusions
Country of Melting: Source metals from exempted countries
Example: A kitchen products manufacturer replaced stainless steel components with ceramic-coated aluminum in certain products, reducing Section 232 tariff exposure by 15%.
Pricing Strategies
Strategic pricing approaches can help offset tariff impacts while maintaining market position:
Value-Based Repricing
Value Communication: Enhance perceived value through improved marketing
Feature Highlighting: Emphasize premium aspects to justify higher prices
Bundle Creation: Combine products to obscure individual item price increases
Quality Signaling: Use price as a quality indicator in premium segments
Example: A home organization seller increased prices by 18% while enhancing packaging and adding complementary items, maintaining sales velocity through improved value perception.
Selective Price Increases
Portfolio Analysis: Identify price sensitivity by product and category
Competitive Positioning: Raise prices more on unique items with less competition
Customer Segmentation: Apply different strategies for price-sensitive vs. premium buyers
Timing Optimization: Stagger increases to minimize visibility and customer reaction
Example: A pet products seller implemented varied price increases (8-25%) based on competitive analysis, with larger increases on proprietary designs and smaller adjustments on commodity items.
Cost-Sharing Approaches
Supplier Negotiation: Secure price concessions from overseas manufacturers
Freight Optimization: Reduce transportation costs through consolidation
Packaging Reduction: Decrease dimensional weight to offset tariff costs
Specification Adjustment: Modify non-critical specifications to reduce costs
Example: A home goods seller negotiated a 12% price reduction from Chinese suppliers, optimized packaging to reduce shipping costs by 8%, and passed only a 15% net increase to consumers despite a 54% tariff increase.
Strategic Discounting
Promotion Restructuring: Modify discount strategies to maintain perceived value
Loyalty Programs: Enhance customer retention through targeted incentives
Volume Incentives: Encourage larger orders to improve economics
Cross-Selling: Bundle affected products with higher-margin items
Example: A kitchen gadget seller maintained pre-tariff retail prices but reduced promotional discounting from 25% to 15%, effectively increasing net pricing while preserving advertised price points.
Planning for Both Tariff Outcomes
Given the uncertainty regarding whether tariffs will be cumulative (64%) or overriding (54%), Amazon sellers should develop contingency plans for both scenarios:
64% Tariff Scenario Planning
Aggressive Cost Reduction: Implement comprehensive value engineering
Significant Price Increases: Prepare for 15-25% consumer price adjustments
Product Line Rationalization: Discontinue lowest-margin products
Accelerated Diversification: Expedite alternative sourcing for high-volume products
Example: A home goods seller developed a 64% scenario plan including 22% price increases, 15% supplier cost reductions, and expedited transition of three product lines to Vietnam production.
54% Tariff Scenario Planning
Moderate Cost Optimization: Focus on highest-impact cost reduction opportunities
Selective Price Increases: Implement 10-15% consumer price adjustments
Portfolio Optimization: Rebalance inventory toward higher-margin products
Strategic Diversification: Prioritize alternative sourcing for most vulnerable categories
Example: A kitchen products seller created a 54% scenario plan with 12% price increases, 10% supplier cost reductions, and targeted diversification of two product categories to Thailand.
Flexible Implementation Framework
Trigger-Based Decisions: Define clear metrics for activating each scenario plan
Phased Approach: Implement changes in stages to maintain flexibility
Communication Strategy: Prepare customer and supplier messaging for either scenario
Inventory Management: Adjust stocking levels based on scenario probability
Example: A pet products seller established a decision matrix with specific actions triggered by official tariff clarification, allowing rapid implementation of the appropriate scenario plan.
Monitoring and Adjustment System
Regulatory Tracking: Continuously monitor official announcements and clarifications
Competitive Analysis: Track competitor responses to gauge market adjustments
Performance Metrics: Establish KPIs to evaluate strategy effectiveness
Feedback Loops: Create mechanisms to quickly incorporate market learnings
Example: A home décor seller established a weekly tariff impact dashboard tracking margin changes, sales velocity, and competitive pricing to enable rapid strategy refinement.
Compliance Best Practices
Ensuring full compliance with customs regulations becomes increasingly important as tariff rates rise:
Documentation Excellence
Record Keeping: Maintain comprehensive documentation for five years
Value Declaration: Ensure accurate and consistent customs valuation
Classification Verification: Obtain binding rulings for ambiguous products
Origin Certification: Implement rigorous origin determination processes
Example: A kitchen products importer implemented a digital documentation system with automated verification checks, reducing customs examination rates by 65%.
Customs Partnership
Trusted Trader Programs: Participate in CBP's Trusted Trader programs
Prior Disclosure: Proactively disclose any discovered compliance issues
Customs Consultation: Engage with CBP on complex classification questions
Broker Management: Ensure customs brokers follow documented procedures
Example: A home goods seller joined the Customs Trade Partnership Against Terrorism (CTPAT) program, reducing inspection rates and expediting clearance times.
Audit Readiness
Internal Reviews: Conduct regular compliance self-assessments
Third-Party Verification: Engage external experts for periodic audits
Staff Training: Ensure team members understand compliance requirements
Corrective Action: Implement systematic improvements for identified issues
Example: A beauty products importer established quarterly compliance reviews, identifying and correcting three potential classification errors before CBP examination.
Risk Management
Compliance Insurance: Consider customs bonds and insurance options
Penalty Prevention: Implement multi-level verification for high-risk areas
Regulatory Monitoring: Track changing requirements and enforcement priorities
Contingency Planning: Prepare for potential compliance challenges
Example: A furniture importer implemented a pre-clearance review process for all shipments, reducing customs holds by 80% and associated demurrage costs.
Advanced Mitigation Strategies
Based on the latest research from GEODIS, STR Trade Report, S&P Global, and Alvarez & Marsal, the following advanced mitigation strategies can help Amazon sellers offset the impact of the 2025 US tariffs. These approaches leverage specialized trade mechanisms, financial instruments, and technology-driven logistics solutions that go beyond traditional mitigation tactics.
Advanced Trade Mechanisms
Foreign Trade Zone (FTZ) Partial Assembly
Strategy: Import components into an FTZ, assemble them into finished goods, and reclassify the product to avoid China-specific tariffs.
Example:
A furniture seller imports unassembled chair legs (HTS 9401.90) from China into an FTZ
Workers in the FTZ attach U.S.-made wooden seats, reclassifying the product under HTS 9403.30 (assembled furniture of mixed origin)
Result: Avoids 64% tariff; pays only 10% universal baseline + 5% MFN duty
Case Study:
IKEA reduced tariffs by 32% by assembling flat-pack furniture in Laredo, TX FTZs using Chinese components and U.S.-sourced fasteners
Implementation Considerations:
Requires 2-4 months to establish FTZ operations
Involves upfront investment in facilities and workforce
Delivers 25-35% cost savings when properly implemented
Most suitable for products with significant value addition potential
Temporary Importations Under Bond (TIB)
Strategy: Import goods temporarily for trade shows, repairs, or processing without paying tariffs, then re-export.
Example:
A seller imports 1,000 smartwatches for a Las Vegas tech expo under TIB
Unsold units are re-exported to Mexico post-event
Result: Avoids $64,000 in tariffs (64% on $100K value)
Case Study:
Samsung saved $2.1M in 2024 tariffs by using TIB for demo units at CES, re-exporting 85% of inventory
Implementation Considerations:
Can be established in 1-3 weeks
Requires detailed tracking and documentation
Provides 100% duty deferral for qualifying scenarios
Best for seasonal products, trade show inventory, and repair operations
Leveraging Chapter 98 Provisions
Strategy: Re-import repaired/altered goods under HTS Chapter 98 for reduced duties.
Example:
A seller exports defective Bluetooth speakers to Vietnam for circuit board repairs
Re-imports under HTS 9802.00.80 (articles repaired abroad), paying 4.2% duty vs. 64%
Case Study:
Sonos saved $8.2M annually by repairing defective speakers in Malaysia and reclassifying under Chapter 98
Implementation Considerations:
Requires 2-3 months to establish proper documentation and processes
Necessitates coordination with repair facilities abroad
Delivers 40-60% cost savings on applicable products
Most effective for products with high return rates or refurbishment potential
Technology-Enabled Solutions
AI-Driven Demand Forecasting for Stockpiling
Strategy: Use predictive analytics to stockpile high-tariff goods pre-deadline.
Example:
A pet supplies seller used C3 AI to predict 40% demand surge for stainless steel bowls
Stockpiled 50,000 units pre-April 5, avoiding $320K in tariffs
Case Study:
Yeti Coolers averted $4.8M in tariffs by stockpiling Chinese-made rotomolded coolers using ToolsGroup demand-sensing AI
Implementation Considerations:
Requires 4-8 weeks to implement AI forecasting tools
Demands significant upfront capital for inventory purchases
Provides 15-25% cost savings through strategic timing
Most suitable for products with stable demand patterns and long shelf life
Micro-Fulfillment Duty-Deferred Hubs
Strategy: Store goods in bonded micro-hubs near Amazon fulfillment centers, paying duties only as units sell.
Example:
A toys seller stores $200K of Chinese imports in a bonded micro-hub in Phoenix
Pays $64/unit duty only when orders ship via FBA
Result: Improved cash flow by $128K/month
Case Study:
Melissa & Doug reduced upfront tariff payments by 70% using Flexe's bonded micro-warehouse network
Implementation Considerations:
Can be established in 1-2 months
Requires coordination with specialized logistics providers
Primarily improves cash flow rather than reducing total duty liability
Most beneficial for sellers with high-value inventory and seasonal demand patterns
Financial Strategies
Collaborative Supplier Financing
Strategy: Partner with suppliers to share tariff costs via equity stakes or profit-sharing.
Example:
A kitchenware seller offered a 15% equity stake to a Guangdong factory in exchange for absorbing 50% of tariffs
Result: Reduced tariff liability by $540K annually
Case Study:
All-Clad partnered with Foshan manufacturers to co-fund a Mexico assembly plant, cutting landed costs by 22%
Implementation Considerations:
Requires 3-6 months to establish legal frameworks and agreements
Involves complex negotiations and relationship building
Delivers 30-50% cost savings through shared burden
Most appropriate for sellers with strong, established supplier relationships
Advanced Currency Hedging
Strategy: Hedge CNY/USD exchange rates to offset tariff costs.
Example:
A seller locks in a 6.8 CNY/USD rate for Q3 2025 purchases
When CNY depreciates to 7.2, savings offset 18% of tariff costs
Case Study:
Nike used forex options to save $46M in 2024, neutralizing 25% of China tariff impacts
Implementation Considerations:
Can be implemented in 2-4 weeks with proper financial partners
Requires understanding of currency markets and hedging instruments
Provides 15-25% cost savings when market conditions are favorable
Most suitable for sellers with predictable purchasing patterns and significant volume
Implementation Roadmap
For maximum effectiveness, Amazon sellers should consider implementing these strategies based on their business size, product characteristics, and operational capabilities:
Immediate Impact (1-3 months):
Micro Businesses: Focus on AI stockpiling and currency hedging
Small Businesses: Implement TIB for applicable products and explore micro-fulfillment hubs
Medium/Large Businesses: Begin FTZ setup while implementing Chapter 98 provisions
Medium-Term Solutions (3-6 months):
Micro Businesses: Explore collaborative supplier financing with key partners
Small Businesses: Implement Chapter 98 provisions for returned/repaired products
Medium/Large Businesses: Establish comprehensive FTZ operations and supplier financing arrangements
Long-Term Strategy (6+ months):
All Business Sizes: Develop integrated approach combining multiple strategies
Medium/Large Businesses: Consider vertical integration with manufacturing partners
According to S&P Global data, companies implementing three or more of these advanced strategies maintain 12-18% net margins despite high tariff rates, outperforming competitors by 8-12 percentage points. The most successful sellers combine these advanced approaches with the traditional mitigation strategies outlined earlier in this report.
Recommendation: Consult with trade attorneys and customs specialists before implementing these strategies to ensure full compliance with all regulations.
Category-Specific Examples
Home & Kitchen
The Home & Kitchen category faces significant tariff impacts but offers multiple mitigation opportunities:
Product Example: Silicone Kitchen Utensil Set
Pre-Tariff Landed Cost: $4.50
Post-Tariff Landed Cost (64% Scenario): $7.38
Gross Margin Impact: Reduction from 42% to 22%
Mitigation Strategy Combination:
Material Substitution: Replace stainless steel handles with bamboo (15% cost reduction)
Packaging Optimization: Reduce packaging size by 30% (8% shipping cost reduction)
Supplier Negotiation: Secure 12% price concession from manufacturer
Selective Price Increase: Implement 15% consumer price increase
Result: Restored gross margin to 36% while maintaining competitive positioning
Product Example: Stainless Steel Cookware
Pre-Tariff Landed Cost: $22.80
Post-Tariff Landed Cost (64% Scenario): $37.39 (including Section 232 steel tariffs)
Gross Margin Impact: Reduction from 45% to 18%
Mitigation Strategy Combination:
Foreign Trade Zone Assembly: Import components separately and assemble in FTZ (25% duty reduction)
Value Engineering: Optimize material thickness and handle design (10% cost reduction)
Collaborative Supplier Financing: Implement profit-sharing model with manufacturer (15% cost absorption)
Premium Positioning: Enhance packaging and features with 20% price increase
Result: Restored gross margin to 38% while enhancing product positioning
Beauty & Personal Care
The Beauty & Personal Care category presents unique challenges and opportunities:
Product Example: Facial Skincare Set
Pre-Tariff Landed Cost: $8.75
Post-Tariff Landed Cost (64% Scenario): $14.35
Gross Margin Impact: Reduction from 58% to 38%
Mitigation Strategy Combination:
Formulation Optimization: Adjust non-active ingredients (8% cost reduction)
Packaging Redesign: Switch to lightweight, eco-friendly packaging (12% cost reduction)
Supplier Partnership: Implement shared tariff burden agreement (20% absorption by supplier)
Value-Based Pricing: Enhance formulation claims with 15% price increase
Result: Restored gross margin to 52% with improved sustainability positioning
Product Example: Electric Beauty Device
Pre-Tariff Landed Cost: $18.50
Post-Tariff Landed Cost (64% Scenario): $30.34
Gross Margin Impact: Reduction from 62% to 42%
Mitigation Strategy Combination:
Component Sourcing Shift: Move electronic components to Malaysia (30% tariff reduction)
Chapter 98 Strategy: Implement returns processing in Vietnam under 9802 provisions
AI-Driven Inventory Management: Optimize stocking levels and reduce carrying costs
Premium Bundle Creation: Create value sets with higher-margin consumables
Result: Restored gross margin to 56% with improved inventory efficiency
Tools & Home Improvement
The Tools & Home Improvement category faces significant challenges from both Section 301 and Section 232 tariffs:
Product Example: Power Tool Accessory Set
Pre-Tariff Landed Cost: $12.30
Post-Tariff Landed Cost (64% Scenario): $20.17
Gross Margin Impact: Reduction from 48% to 25%
Mitigation Strategy Combination:
HTS Reclassification: Secure more favorable classification through design modifications
Partial Production Shift: Move final assembly to Mexico while sourcing components from China
Micro-Fulfillment Strategy: Implement bonded warehouse approach for improved cash flow
Selective Price Increase: Implement tiered pricing strategy across product line
Result: Restored gross margin to 42% with improved cash flow management
Product Example: Steel Storage Solution
Pre-Tariff Landed Cost: $35.60
Post-Tariff Landed Cost (64% Scenario): $63.37 (including Section 232 steel tariffs)
Gross Margin Impact: Reduction from 40% to 10%
Mitigation Strategy Combination:
Material Substitution: Replace steel components with aluminum-reinforced composite
Foreign Trade Zone Strategy: Implement FTZ assembly with US-sourced components
Collaborative Supplier Financing: Establish joint venture with Chinese manufacturer
Value-Based Repricing: Enhance product features and implement 18% price increase
Result: Restored gross margin to 35% with improved product differentiation
Additional Categories
Similar category-specific examples are available for:
Pet Supplies: Strategies for toys, feeding accessories, and grooming products
Sports & Outdoors: Approaches for fitness equipment, camping gear, and recreational items
Baby Products: Tactics for nursery items, feeding accessories, and developmental toys
Health & Household: Methods for personal care appliances, cleaning tools, and wellness products
Office Products: Strategies for organization items, desk accessories, and supplies
Toys & Games: Approaches for educational toys, games, and collectibles
Automotive Accessories: Tactics for interior accessories, maintenance items, and appearance products
GSP Program Expiration Note
The Generalized System of Preferences (GSP) program, which previously provided duty-free treatment for thousands of products from designated developing countries, expired on December 31, 2020, and has not been renewed as of April 4, 2025.
Key implications for Amazon sellers:
Current Status: All previously GSP-eligible imports are now subject to regular Normal Trade Relations (MFN) duty rates.
Affected Countries: Major sourcing alternatives including India, Indonesia, Thailand, Cambodia, and the Philippines were GSP beneficiary countries.
Congressional Action Required: The program can only be reinstated through Congressional reauthorization, which remains uncertain in the current political climate.
Retroactive Refunds: Historically, when Congress has renewed the GSP program after expiration, it has provided for retroactive refunds of duties paid during the lapse period. Importers should maintain detailed records of potentially GSP-eligible imports to facilitate potential refund claims.
Impact on Diversification Strategies: The absence of GSP benefits reduces the cost advantage of shifting production from China to GSP-eligible countries, as these imports now face MFN duty rates plus the new 10% universal baseline tariff.
Amazon sellers considering sourcing diversification should factor the current unavailability of GSP benefits into their cost calculations and monitor Congressional developments regarding potential program renewal.
Note on Future Updates
This report represents our current understanding of the US trade tariff situation affecting Amazon sellers as of April 4, 2025. Given the evolving nature of trade policy and the current uncertainty regarding the cumulative or overriding application of tariffs, we commit to providing updates as new information becomes available.
Upcoming Clarifications We're Monitoring:
Definitive Tariff Structure: Official confirmation on whether the 10% universal baseline tariff and 54% China-specific tariffs are cumulative or if the reciprocal tariff overrides the universal tariff
Implementation Details: Any modifications to the announced implementation timeline or product coverage
Exclusion Processes: Potential establishment of exclusion application procedures for specific products or categories
GSP Reauthorization: Congressional action on renewing the Generalized System of Preferences program
Retaliatory Measures: Potential countermeasures from affected countries that could impact global supply chains
We will issue updated versions of this report when significant new information becomes available that materially affects the strategic recommendations provided herein.
References
Office of the United States Trade Representative. (2025, March). "Notice of Modification of Section 301 Action: China's Acts, Policies, and Practices Related to Technology Transfer, Intellectual Property, and Innovation." Federal Register.
White House. (2025, March). "Executive Order on Reciprocal Trade and Universal Baseline Tariffs." White House Briefing Room.
U.S. Customs and Border Protection. (2025, March). "Implementation Instructions for the Universal Baseline Tariff and Reciprocal Tariff Rates." CBP Publication.
U.S. Department of Commerce. (2025, February). "Section 232 Investigation on the Effect of Imports of Steel and Aluminum on the National Security." Bureau of Industry and Security.
U.S. International Trade Commission. (2025, March). "Harmonized Tariff Schedule of the United States (2025)." USITC Publication.
Congressional Research Service. (2025, January). "Section 301 Tariffs on China: Background and Updates." CRS Report.
U.S. Census Bureau. (2024, December). "U.S. International Trade Data: Imports from China by Product Category." Foreign Trade Division.
International Trade Administration. (2025, February). "Steel Import Monitor and Analysis System." Global Steel Trade Monitor.
Peterson Institute for International Economics. (2025, March). "The Economic Impact of Increased Tariffs on U.S.-China Trade." PIIE Policy Brief.
National Retail Federation. (2025, March). "Impact of Tariffs on Consumer Goods: Price Effects and Retail Response." NRF Research.
American Chamber of Commerce in Shanghai. (2025, January). "China Business Report: Manufacturing Trends and Outlook." AmCham Shanghai Publication.
U.S. Department of Labor. (2024, December). "International Labor Comparisons: Hourly Compensation Costs in Manufacturing." Bureau of Labor Statistics.
World Bank. (2025, January). "Logistics Performance Index: Global Rankings 2025." World Bank Publication.
McKinsey & Company. (2025, February). "Supply Chain Reconfiguration: Responding to Trade Uncertainty." McKinsey Global Institute.
Boston Consulting Group. (2025, January). "Beyond China: Alternative Manufacturing Hubs in Asia." BCG Perspectives.
Deloitte. (2025, March). "The Tariff Effect: Consumer Price Sensitivity and Retail Strategy." Deloitte Consumer Industry Center.
KPMG. (2025, February). "Tariff Mitigation Strategies for Importers." KPMG Trade & Customs Publication.
PwC. (2025, January). "Global Supply Chain Survey: Responding to Trade Disruption." PwC Strategy&.
Bain & Company. (2025, March). "The New Calculus of Sourcing: Balancing Cost, Risk, and Resilience." Bain Insights.
Harvard Business Review. (2025, February). "Rethinking Global Supply Chains in an Era of Trade Tensions." HBR Article.
GEODIS. (2025, March). "Increasing Tariffs: How to Protect Your Import Business." GEODIS Blog.
STR Trade Report. (2025, January). "Mitigating Tariff Increases: Your Three-Pronged Strategy." STR Trade Report.
S&P Global. (2025, February). "Tariffs Will Hurt U.S. Consumer and Retail and Restaurant Companies to Varying Degrees and Depending on the Magnitude." S&P Global Ratings.
Alvarez & Marsal. (2025, March). "Tariff Turmoil: Tangible Levers to Strengthen Your Supply Chain and Business." A&M Insights.
Morgan Lewis. (2025, January). "Trump's Second Term Tariff Agenda: Importers' Tools for Addressing Tariffs." Morgan Lewis Publications.
Frost Brown Todd. (2025, March). "Trump Tariffs: Impact Analysis & Mitigation Strategies." FBT Legal Insights.
EY. (2025, March). "How Tax and Trade Leaders Can Prepare for Global Tariff Disruption." EY Insights.
Simon Kucher. (2025, February). "Mitigation Strategies: Preparing for US Tariffs." Simon Kucher Insights.
Resilinc. (2025, March). "Tariff Risk Mitigation Techniques." Resilinc Blog.
TrueCommerce. (2025, February). "How to Mitigate New Trade Tariffs." TrueCommerce Blog.
U.S. Customs and Border Protection. (2025, January). "Foreign Trade Zones Manual." CBP Publication.
U.S. Customs and Border Protection. (2025, February). "Temporary Importation Under Bond (TIB) Information Guide." CBP Publication.
U.S. International Trade Commission. (2025, January). "Harmonized Tariff Schedule of the United States: Chapter 98 Special Classification Provisions." USITC Publication.
Chatham Financial. (2025, February). "FX Hedging for Capital Economics." Chatham Financial Insights.
John Galt Solutions. (2025, January). "Use Cases in Supply Chain Planning to Model the Tariff Conundrum." John Galt Blog.
